Currently viewing: Implementation report / Next: Seven-year performance history

Implementation report

3. REMUNERATION IMPLEMENTATION REPORT

3.1

Introduction

This implementation report discloses the remuneration outcomes for executive directors for the 2020 financial year.

Fair and responsible pay

  • The Board Human Resources and Remuneration Committee ensures, on an ongoing basis, that the organisation remunerates fairly, responsibly and transparently so as to promote the achievement of strategic objectives and positive outcomes in the short, medium and long term.
  • To this end, the Group executive holds management accountable for ensuring that total remuneration is distributed fairly and ensures appropriate oversight; and where differentials exist, that they can be reasonably explained.
  • The Board Human Resources and Remuneration Committee is committed to ensuring the remuneration of executive management is fair and responsible in the context of overall employee remuneration.

3.2

Remuneration outcomes
3.2.1

Non-binding shareholder vote

The 2019 Remuneration Report received 70.14% and 66.74% votes in favour of the Remuneration and Implementation Report's respectively. As per King IV requirements, if more than 25% of its members' present votes again both Remuneration Report and Implementation Report, the governing body has to engage with those shareholders. We have subsequently engaged with key shareholders to address their concerns and have taken their valuable suggestions into consideration with the revised 2020 Remuneration Report. The key considerations are highlighted in the Chairman's report of the Human Resources and Remuneration Report.

3.2.2

Guaranteed remuneration

The increases in annual guaranteed packages in January 2020 are set out in the table below:

Guaranteed
package
% increase
 
Group executives 5.0   5.9 total
Group executives with additional responsibilities** 8.6  
Senior executives and top management 4.9  
Clinical staff 5.9  
Other staff 6.0  
Total 5.8  
** An average increase of 5% was granted to the Group executives, however, additional adjustments were made to the remuneration of two Group executives who assumed additional responsibility which resulted in their market benchmarks being revised upwards. This led to the overall 5.9% increase, at executive level.


3.2.2.1

Total single figure of remuneration

The tables below reflect the actual amounts paid as well as earned year-on-year for FY2019 and FY2020:

Dr S Viranna
CEO**
 
P Wharton-Hood
CEO*
 
PP van der
Westhuizen
CFO
 
FY2020 
R'000
 
FY2019 
R'000 
FY2020 
R'000
 
FY2019 
R'000 
FY2020 
R'000
 
FY2019 
R'000 
 
Salaries  3 083  5 887  641  5 333  4 084   
Other allowances  31  33  10  146  95   
Medical aid  5  32  –  6  37   
Retirement fund  129  247  27  226  174   
Guaranteed package  3 249  6 199  678  5 711  4 391   
% increase  (46.3%) –  30.1% 
Outperformance Incentive scheme  –  –  –  –  1 853  –   
Long service award  –  –  –  5   
Leave paid out  14  –  –  –  –  –   
VCP earned in FY  –  7 087  –  3 394  3 564   
Vested Company matched shares  2 805  3 038  –  –  –  –   
Gains on Long-term Incentive Scheme ✘  –  –  –  –  776  872   
Performance and other  2 819  10 125  –  –  6 023  4 441   
% increase  (60.2%) 35.6% 


Dr S Viranna
CEO**
 
P Wharton-Hood
CEO*
 
PP van der
Westhuizen
CFO***
 
FY2020 
R'000
 
FY2019
R'000 
FY2020 
R'000
 
FY2019
R'000 
FY2020 
R'000
 
FY2019 
R'000 
 
Acting allowance  –  –  –  –  300  –   
Acting performance bonus  –  –  –  –  2 125  –   
Total acting remuneration  2 425 
Total remuneration earned in FY  6 068  16 323  678  –  14 161  8 832   
% increase  (53.8%) –  60.3% 


Dr S Viranna
CEO**
P Wharton-Hood
CEO*
PP van der
Westhuizen
CFO
FY2020
R'000 
  FY2019
R'000
  FY2020
R'000
  FY2019
R'000
  FY2020 
R'000 
  FY2019
R'000
 
STI performance bonus (H2 of prior year) 4 463   6 501   –   –   2 311    5 100  
Total remuneration 4 463   6 501   –   –   2 311    5 100  
% increase 46.9%   –   (54.7%)  
Total remuneration paid in FY 10 531   15 738   678   –   13 078    10 368  
% increase 15.9%   –   26.1%   
* Peter Wharton-Hood commenced services as CEO on 1 September 2020. His remuneration thus only reflects one month of service and no bonus as tenure too short to measure performance.
** The CEO terminated his employment on 17 January 2020 and ceased to be a director effective 21 January 2020. No STI payment was made. He was however in service at the second vesting of the Company matched shares, which vested on 1 February 2020 (Gross amount – R2 804 870). The first vesting of Company matched shares (as reflected under FY2019 above occurred on 1 February 2019 – gross value R3 038 050.
*** Please refer to acting remuneration and outperformance bonus under paragraphs 3.2.6 and 3.2.5 respectively.
✘ Please refer to paragraph 3.2.3.1 with regards to the gains realised due to the vesting of the LTIP 2017 scheme allocation.

A Pyle
CEO: SA**
M Chapman****
CEO: International
FY2020 
R'000 
  FY2019
R'000
  FY2020
£'000
  FY2019
£'000
 
Salaries 3 331    3 374   £268   £92  
Other allowances 18    194   £13   £3  
Medical aid 6    37   –   –  
Retirement fund 151    142   £28   £9  
Guaranteed package 3 507    3 747   £308   £104  
% increase (6.4%)   195.2%  


A Pyle
CEO: SA
M Chapman****
CEO: International
FY2020
R'000
  FY2019
R'000
  FY2020
£'000
  FY2019
£'000
 
Outperformance Incentive Scheme 1 273   –   –   –  
VCP earned in FY 2 012   2 357   £170   £67  
Gains on Long-term Incentive Scheme✘ 405   –   –   –  
Performance and other 3 690   2 357   £170   £67  
% increase 56.6%   153.5%  
Total remuneration earned in FY 7 196   6 104   £478   £171  
% increase 17.9%   178.9%  


A Pyle
CEO: SA
M Chapman****
CEO: International
FY2020 
R'000 
  FY2019
R'000
  FY2020
£'000
  FY2019
£'000
 
STI performance bonus (FY2019 H2) 1 370    1 752   £67   –  
Total remuneration 1 370    1 752   £67   –  
% increase (21.8%)   –  
Total remuneration paid in FY 6 555    5 499   £375   £104  
% increase 19.2%    259.7%  
**** Mark Chapman was appointed CEO International from 1 June 2019, thus only four months of FY2019 reflected. Salaries are reflected in British Pounds.
3.2.3 Short-term incentivisation

Given the uncertainty and negative impact of the COVID-19 pandemic, the full Group executive agreed to delay their short-term incentive payment due in April 2020 to the end of year.

Because Life Healthcare played a pivotal role in fighting the disease on the frontline, the Board and management agreed to set specific objectives for H2 FY 2020 to manage the operational, health and safety challenges brought about by the COVID-19 pandemic. The financial measures constituted 40% of the total weighting whilst the various aspects of managing under COVID-19 conditions made up the balance. This weighting aligns with the predominant focus of management during this challenging time.

The Board will closely monitor performance against agreed targets during FY2021 and may apply discretion to outcomes should there be a significant divergence from the macro assumptions underlying our plan.

Stretch budgets are set at the beginning of the financial year. These are agreed with the Life Healthcare Board.

The financial measures are rewarded as per the table set out below:

Actual % against
stretch budget
Rating %
payment
87.5% 1.00 0%
88.3% 2.00 25%
90.0% 3.00 50%
91.7% 4.00 75%
95.0% 5.00 100%
100.0% 6.00 125%

The outcome of the performance scorecard for the Group executive in respect of FY2020 was as follows.

Period Measurement category Weighting   Rating   %
Award
  Weighted
Award
 
H1 Company Financial 70%   4   75%   52.5%  
Non-financial 30%   4   100%   30.0%  
Total     82.5%  
H2 Company Financial 40%   3   50%   20%  
Non-financial 60%   6   140%   84%  
Total     104%  

However, as per agreement with the Board, H2 award will be capped at 100% in respect of the Group executive.

Group Financial Rating

H1 Financial scorecard performance metrics H1   H1 
Target 
  H1 
Actual 
  % 
Achievement 
  Rating %
Award
70% Group EBITA (R'm) 70%   2 142    2 126    99.2%    4.00 75%
Group working capital management (R'm) 30%   (223)   (529)   (42.2%)  


H2 Financial scorecard performance metrics H2   H2 
Target 
  H2 
Actual 
  %
Achievement
  Rating %
Award
40% Group EBITA (R'm) 70%   4 656    2 694    57.9%   3.00 50%
Group working capital management (R'm) 30%   (131)   (49)   267.3%  

Personal team rating (H2 – 60% weighting)

Measure Achievement
Clinical Metrics The Group exceeded its clinical metrics and despite the challenges of COVID-19 produced the best quality metrics in the Company's history. This is a reflection of the processes in place, careful management and focus on the key quality initiatives by both the SA and International businesses.
Strategic Innovation Objectives pertained to the development of a funders' strategy for SA and a PET-CT strategy for the international business. Both objectives were met.
People An agreed succession plan was developed, presented and approved by the Board. Key resourcing strategies for critical positions have been actioned.
COVID-19 specific deliverables The following key outputs were delivered during the COVID-19 surge:
  • COVID-19 specific plans covering facilities, operational, staffing and clinical interventions were implemented
  • The Group adopted guidelines issued by the DoH, NICD, WHO and various medical societies
  • Ensured sufficient availability of PPE and the appropriate usage of this to ensure staff, doctors and patient safety as well as the management of costs associate with this (had sufficient stock levels)
  • Universal masking implemented in order to reduce transmission risk, including cloth masking our employees when not at work
  • Implementation of a dynamic forecasting model used for logistical, capacity and employee planning
  • Employee efficiency and safety measures which included deployment strategies, hygiene and social distancing, travel policies, leave, communication campaigns, wellness initiatives, infection prevention which included PPE utilisation and a freeze on non-essential recruitment.

  • Facilities management:
    • Entrances reduced and screening protocols implemented at all facilities
    • Visiting patients suspended, with limited exceptions
    • Operational model created for all hospitals
    • Detailed 'surge' plans prepared by all facilities within the Group guidelines, covering:
      • reconfiguration of existing wards within different surge scenarios
      • patient flow (split between COVID-19 and non-COVID-19)
      • employee planning
      • doctor capacity
      • A&E triage and patient flow/isolation
    • The Group implemented plans across its facilities to ensure that the COVID-19 risk is appropriately managed, including testing, screening and facility quality, people and safety plans, incorporating guidelines from various medical societies as well as international best practice.
  • Effective reputation management
  • An internal communications campaign focused on maintaining staff morale, building Company loyalty and expressing the values of appreciation, care and hope
  • Ensured successful implementation of capital preservation
  • Agreed pricing agreements with provincial governments

In addition to the specific COVID-19 management initiatives the management team also had to deal with the cyber-incident during this time. The IT incident stretched management's ability to manage COVID-19 as well as the day-to-day operations. The cyber-incident reflected the strength of management at a facility level. Overall we were able to continue admitting patients without impacting the quality of care and once systems were back-up submit bills to the medical aid and collect the funds.
OVERALL RATING 6 out of 7 which results in payment of 140% of targeted reward

The targeted % of Total Cost to Company for the Group executive and the payment made in respect of each period is set out below. Please note that no STI payment was made to the newly appointed CEO as one month's service was insufficient to measure his performance contribution:

PP van der Westhuizen
CFO
A Pyle
CEO – SA
M Chapman
CEO – International
 
Targeted % of TCTC 65% 57.5% 57.5%  
H1 R1 534 345 R909 445 £91 317  
H2 R1 859 813 R1 102 357 £79 063  
Total R3 394 158 R2 011 802 £170 380  
3.2.4

Long-term incentivisation

The LTI details regarding the vesting of the 2017 allocation, the two unvested 2018 and 2019 allocations and the recent 2020 allocations are set out below.

3.2.4.1 Vesting of the LTIP 2017 Allocation
 

As advised in the Remuneration Report, the outcome of performance against vesting criteria shows that the LTIP 2017 allocation yielded a partial vesting (80%) of the TSR component.

The details were as follows:

Performance measure Weight   Outcome Result  
Actual TSR compared to a comparator group of companies 50%   Life Healthcare ranked at the 56th percentile against the comparator group 80% vesting  
Actual EBIT growth compared to a composite inflation rate plus a hurdle rate 50%  
Average composite inflation = 4.4%
Compound annual growth EBIT = (0.2%)
Over/under composite CPI = (4.6%)
No payment  

In South Africa, the after-tax value generated from the scheme was utilised to purchase Life Healthcare shares in the open market which is then delivered to recipients' personal trading accounts.

The vesting details per executive are as follows:

Job Title Date of
Allocation
  Offer
Price
Number of
Notional
Per-
formance
Shares
  Vesting
Date
  No of
Shares
vested
Price at
Exercise
Date
Gross
Payment
 
AM Pyle 01-Jan-17   31.59 34 126   31-Dec-19   41 418 R24.46 R405 272  
Rights issue adjustment to performance shares 24.50 7 292  
PP van der Westhuizen 01-Jan-17   31.59 65 380   31-Dec-19   79 350 R24.46 R776 434  
Rights issue adjustment to performance shares 24.50 13 970  
3.2.4.2 Historical LTIP Allocations (unvested)
 
  • LTIP 2018 Once-Off Alternative

The once-off alternative cash offering is based on an additional third of the FY2018, FY2019 and FY2020 short-term bonus outcomes which will be banked and payment will be made in January 2021 to coincide with the date when the normal LTIP 2018 allocation would have vested. Please refer to 2.1.4 of the Remuneration Report. The final payment will be made in January 2021 and details will be reflected in the 2021 Remuneration Report.

  • Unvested LTIP 2019 scheme allocations

The details of allocations made in 2019 are set out below:

First Name Job Title Date of
Allocation
  Offer
Price
Per-
formance
Shares
  Vesting
Date
  Allocation
Value
R'000
Value
based on
30 Sept
2020
share
price
R'000
 
Pyle AM Chief Executive Officer - SA 01-Jan-19   25.86 114 969   31-Dec-21   2 973 359 1 961 371  
Van Der Westhuizen PP Chief Financial Officer 01-Jan-19   25.86 220 803   31-Dec-21   5 710 477 3 766 899  
Viranna SB ** Chief Executive Officer 01-Jan-19   25.86 235 992   31-Dec-21   6 103 308 4 026 024  
Chapman M Chief Executive Officer – International 01-Jan-19   25.86 127 191   31-Dec-21   3 289 444 2 169 878  

** The performance shares for Dr SB Viranna were forfeited due to his resignation, as per the rules of the LTI Scheme.

3.2.4.3 2020 LTIP Allocation
 

The resignation of Shrey Viranna as CEO on 17 January 2020 left the Group vulnerable to potential executive exits. In particular, the Board held the view that additional measures needed to be implemented to retain the services of the two country Chief Executive Officers: Adam Pyle (SA CEO) and Mark Chapman (International CEO) as well as the CFO (Pieter van der Westhuizen). These executives are critical to ensure continuity in the operations of the Group, which is vital for the short- to medium-term performance and sustainability of the Group.

After considering various retention mechanisms, the Board approved the allocation of restricted Life Healthcare shares (refer to the remuneration report par 2.7 to these executive as well as the application of the existing strategic modifier embedded in the rules of the LTI scheme to 2020 LTIP allocations. To this effect all three executives received enhanced allocations of notional performance shares.

First Name Job Title Share
Allocation
  Offer
Price
Per-
formance
Shares
  Vesting Date   Allocation
Value
R'000
Value
based on
30 Sept
2020
share
price
R'000
 
Van Der Westhuizen PP Chief Financial Officer 01-Jan-20   24.46 434 145   31-Dec-22   4 425 077 7 406 514  
Pyle AM Chief Executive Officer – SA 01-Jan-20   24.46 254 531   31-Dec-22   2 594 344 4 342 299  
Chapman M Chief Executive Officer – International 01-Jan-20   24.46 290 448   31-Dec-22   2 960 429 4 955 043  
3.2.5

Outperformance incentive kicker

The final payment in terms of this scheme was made in February 2020. This scheme was introduced to ensure that top performers were significantly rewarded for their efforts. The duration of the scheme was only for 2 years ending in February 2020.

The Human Resources and Remuneration Committee agree to the ratings ascribed to each Group executive as assessed by the Group Chief Executive Officer. Each component is equally weighted at 20% each and a % award is linked to each rating as follows:

Rating % Award  
1.00 0%  
2.00 50%  
3.00 70%  
4.00 100%  
4.50 120%  
5.00 130%  
5.50 140%  
6.00 150%  
7.00 150%  

The breakdown of the critical sustainability measures and scores (of equal weighting) were as follows:

  • CFO
Historical Performance over prior 4 years for long time view of performance - average out of 7 (4 being on-target) 5  
Innovation – innovative ideas to sustain continued success of the organisation 4  
Talent Retention (expertise and value-talent, difficultly in replacing with a similar skill- and experience set. 5  
Being a cultural ambassador, representative of values and culture of the Company 5  
Complexity of role, including competitor pressures, doctor relationships etc. 6  
Total score 5  

This amounted to a bonus payment of R1 853 473.

  • CEO – southern Africa
Historical Performance over prior 4 years for long time view of performance - average out of 7 (4 being on-target) 5.5  
Innovation – degree to which manager brings original, innovative ideas and solutions that result in sustained continued success of the organisation 4  
Talent Retention (expertise and value-talent) 6  
Being a cultural ambassador, representative of values and culture of the Company 6  
Complexity of role, including competitor pressures, doctor relationships etc. 5  
Total score 5.3  

This amounted to a bonus payment of R1 272 750.

3.2.6

Actuals achieved 2019 and 2020 in relation to 2020 pay mix targets

Total remuneration outcomes for the current and prior financial years for the executive directors are tabulated below. Explanatory footnotes are provided where necessary. All figures are displayed in South African Rand and R'000, except for the CEO International where figures are reflected in British Pounds.

Total Cost to Company (TCTC) based on annual increments granted. STI payments are based on bonuses earned during the financial year, however, not necessarily paid within the financial year under review.

  • Former CEO: SB Viranna

Due to the resignation as CEO on 17 January 2020, only 5 months of the financial year are reflected under Actual Total Cost to Company (TCTC) for FY2020, thus no comparison to prior year can be made. According to policy, no STI payment was made as a result of the resignation and the long-term incentive allocation in respect of the 2019 allocation was forfeited.

R'000 Annual TCTC STI Performance Bonus Total Annual Compensation Actual TCTC Actual STI Performance Bonus Total annual Compensation LTIP Expected Value 1/3rd Co Matched Shares Vested Total Actual Remuneration
FY2019 7 600 7 087 14 687  6 199 7 087  13 285  – 3 038  16 323 
FY2020 7 980 –  7 980  3 249 –  3 249  – 2 805  6 054 
% increase 5% (100.0%) (45.7%) – (100%) (76%) – (8%) (8%)

The CEO purchased LHC shares to the value of R3 million in 2018 as agreed on appointment. The Company matched with a purchase of restricted LHC shares to the value of R9 million (337 096 shares @ issue price of R26.46). Vesting would occur in 3 equal tranches over a period of 3 years. The second vesting occurred on 1 February 2020 - gross value R2 805 000. The last tranche was forfeited due to his resignation.

  • CEO: P Wharton-Hood

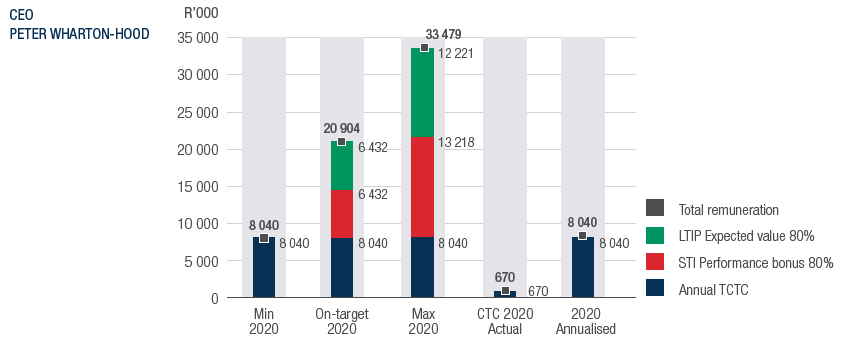
As the appointment of the new CEO appointment was made on 1 September 2020, only one month's actual remuneration has been paid and no comparison to the prior year can be made. Figures have been annualised to reflect remuneration against minimum, on-target and maximum incentive potential payments.

As detailed in paragraph 2.3 of the Remuneration Report, Peter Wharton-Hood invested in Life Healthcare shares, which was matched by the Company with a purchase of restricted shares to the value of R15 million. These are held in an escrow account and will vest over five years, provided certain performance conditions are met. Please refer to paragraph 2.6 of the Remuneration Report.

R'000   Annual TCTC   STI Performance Bonus   Total Annual Compensation   LTIP Expected Value   Total Actual Remuneration  
  80%   80%
Min 2020   8 040   –   8 040   –   8 040  
On-target 2020   8 040   6 432   14 472   6 432   20 904  
Max 2020   8 040   13 218   21 258   12 221   33 479  
Annual 2019   –   –   –   –   –  
CTC 2020 actual   670   –   670   –   670  
2020 annualised   8 040   –   8 040   –   8 040  
  • CFO: PP van der Westhuizen

The CFO acted in the role of CEO for the period 17 January 2020 to 31 August 2020 following the resignation of the previous CEO. Remuneration linked to this acting appointment, which included an enhanced performance bonus was introduced (as set out below). He also received the last payment in respect of the Outperformance Scheme in February 2020 (please refer to par 4.2.4 above).

Acting Remuneration

The Board approved additional guaranteed remuneration to the CFO for his role as Acting CEO while the Company recruited a suitable CEO replacement.

In addition, it was agreed that the CFO would receive a performance dependent bonus. The quantum was based on the delta between the VCP due to the former CEO for performance in the period under review minus the CEO's on-target short-term incentive. The on-target performance amounts to R2 125 000 for the period.

Key strategic and operational deliverables that he was held accountable for during his acting capacity, were as follows:

  • Delivering on the Group short-term incentive scorecard
  • Leading and directing the Group executive
  • Accountable for effective management of the business during the COVID-19 pandemic
  • Restoration of IT systems, business operations, financial reporting, cash collections and communication barriers as a result of the recent cyber-attack on all systems
  • Supporting the integration and transition of the new CEO on appointment.

Performance Outcomes

The CFO voluntarily forfeited the first 6-months of the fixed portion of the acting remuneration, to the amount of R1.2 million towards the Employee Assistance Fund to support employees in dire financial constraints as a result of the pandemic. The balance of R300 000 for the period between 18 July 2020 and 31 August 2020 was paid to him.

In terms of the performance-linked acting bonus, Pieter effectively fulfilled both CFO and CEO roles and was instrumental in leading the Group executive, both locally and internationally, during the unprecedented Covid-19 pandemic. The full on-target acting bonus of R2 125 000 has been paid to him.

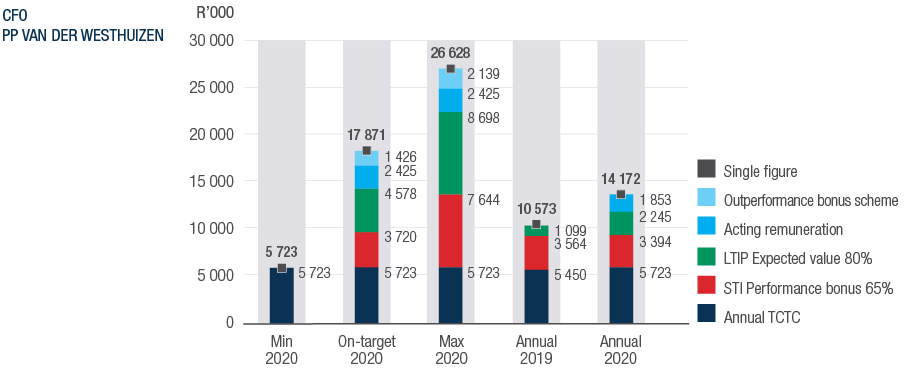
Total remuneration against FY2019 and pay mix targets for FY2020 are set out below:

R'000 Annual TCTC STI Performance Bonus Total Annual Compensation LTIP Expected Value Acting Remuneration Outper-formance Bonus Scheme Total Actual Remuneration  
Targeted reward 65% 80%
Min 2020 5 723 5 723 5 723  
On-target 2020 5 723 3 720  9 442 4 578 2 425 1 426 17 871  
Max 2020 5 723 7 644  13 366 8 698 2 425 2 139 26 628  
Annual 2019 5 450 3 564  9 014 459 1 099 10 573  
Annual 2020 5 723 3 394  9 117 776 2 425 1 853 14 172  
Year-on-year 5.0% (5%) 1% 69% 34%  
  Excluding Acting Remuneration 11%  

  • CEO SA: AM Pyle

Adam Pyle has successfully managed the SA operations during his two-year tenure as CEO SA from 1 January 2019. He was participant in Outperformance Bonus for the second payment, details of which can be found in paragraph 4.2.4. Due to tenure, no LTIP payment was due in FY2019 (three-year vesting).

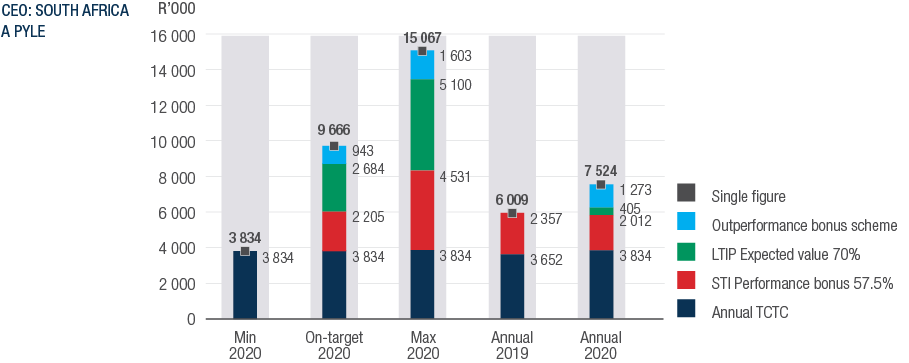
R'000 Annual TCTC STI Performance Bonus Total Annual Compensation LTIP Expected Value Outperformance Bonus Scheme Outperformance Bonus Scheme  
Targeted reward 57.5%  70%
Min 2020 3 834 –  3 834  3 834  
On-target 2020 3 834 2 205  6 039  2 684 943 9 666  
Max 2020 3 834 4 531  8 365  5 100 1 603 15 067  
Annual 2019 3 652 2 357  6 009  – – 6 009  
Annual 2020 3 834 2 012  5 846  405 1 273 7 524  
Year-on-year 5.0% (14.6%) (3%) 100% 100% 25%  
 
  • CEO International: M Chapman
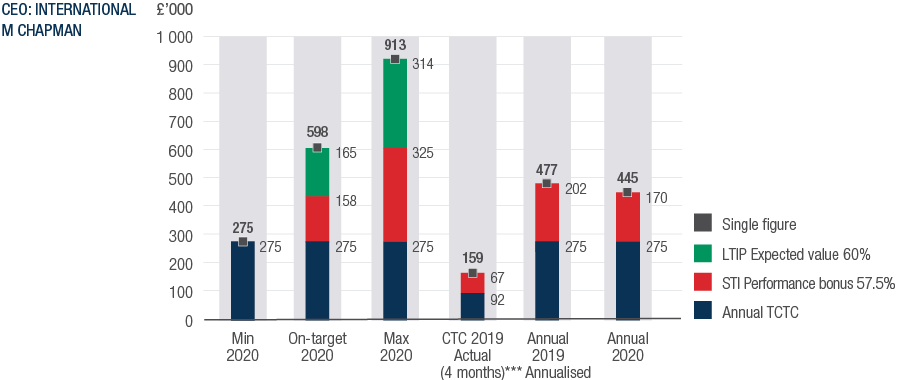
Mark Chapman was appointed CEO International from 1 June 2019. *** Remuneration for FY2019 has been annualised for comparative purposes. Salary is reflected in British Pound (£). As part of a legacy long-term incentive scheme, he was granted 10 000 C-shares.

£'000 Annual TCTC   STI Performance Bonus   Total Annual Compensation   LTIP Expected Value   Total Remuneration
Targeted reward (%)     57.5        60.0
Min 2020 275   –    275    –   275 
On-target 2020 275   158    433    165   598 
Max 2020 275   325    600     314   913 
CTC 2019 actual (4 months) 92   67    159    –   159 
2019*** annualised 275   202    477    –   477 
Annual 2020 275   170    445    –   445 
Year-on-year 0.0%   (15%)   (7%)   (7%)

3.3
Exit arrangements – former CEO

The CEO resigned as a director and resigned from all offices and trusteeships held by him in the Employer and any related Company with effect from 17 January 2020.

As he was in service at vesting date, he continued to receive the Company matched shares due to him on 1 February 2020, however, he forfeited the third tranche of 112 366 LHC shares due in February 2021.

Date Initial No of
Shares
Awarded
Shares
Vested
No of
Shares
Retained
No of
Ordinary
Shares Sold
VWAP Value of
transaction
Granted 20-Sep-18 337 096
1/3rd vested 01-Feb-19 112 365 59 197 53 168 R25.8817 R3 038 050
1/3rd vested 01-Feb-20 112 365 60 885 51 480 R25.1802 R2 804 870
Total Vested 120 082 104 648 R5 842 920
Shares Forfeited: 112 366
3.4
Non-executive directors’ fees

The following number of meetings were held between October 2019 to September 2020

Committee No of Meetings 2020  
Main Board 5  
Audit 6  
Human resources and remuneration 3  
Risk, compliance and IT governance 3  
Investment 5  
Clinical 4  
Nominations and governance 4  
Social, ethics and transformation 3  

The following fees were paid for the period October 2019 to September 2020:

Non-Executive Director Oct 2019 to Sept 2020  
MA Brey R1 135 695  
PJ Golesworthy R1 061 204  
ME Jacobs R590 503  
VL Litlhakanyane R220 722  
AM Mothupi R667 220  
JK Netshitenzhe R500 563  
MP Ngatane R572 070  
M Sello R397 149  
GC Solomon R728 808  
RT Vice R712 485  
R6 586 418